
Try searching “share of ad spend by social media platform” on Google or in AI tools.
You’ll end up bouncing gated reports and endless “request a demo” forms.
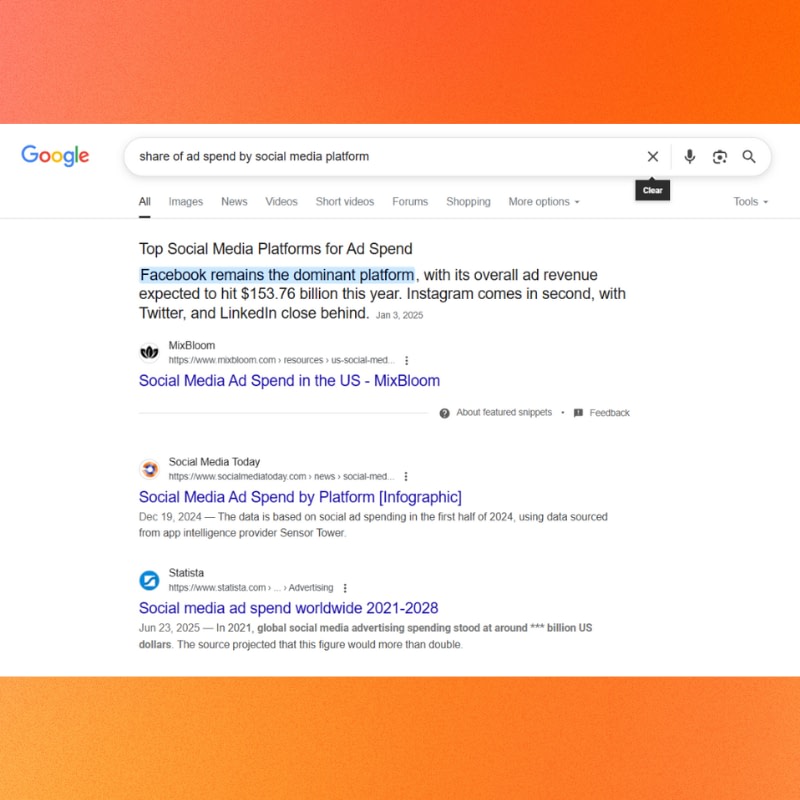
For a simple percentage breakdown, the internet makes you work way too hard.
That’s what this article fixes. Below you’ll find the clean data.
Social media ad spend by platform, Q2 2025
Here’s advertising revenue broken down by social media platform, along with year-over-year change in revenue:
- Meta (Instagram, Facebook, Messenger, WhatsApp, Threads): $46.56B (↑21% YoY)
- YouTube: $9.8B (↑13% YoY)
- TikTok*: $8.25B (↑40% YoY)
- LinkedIn: $4.62B (↑9% YoY)
- Pinterest: $0.99B (↑17% YoY)
- Reddit: $0.46B (↑84% YoY)
Note: TikTok is not publicly traded; the number comes from third-party estimates.
And here’s share of ad spend by social media platform:
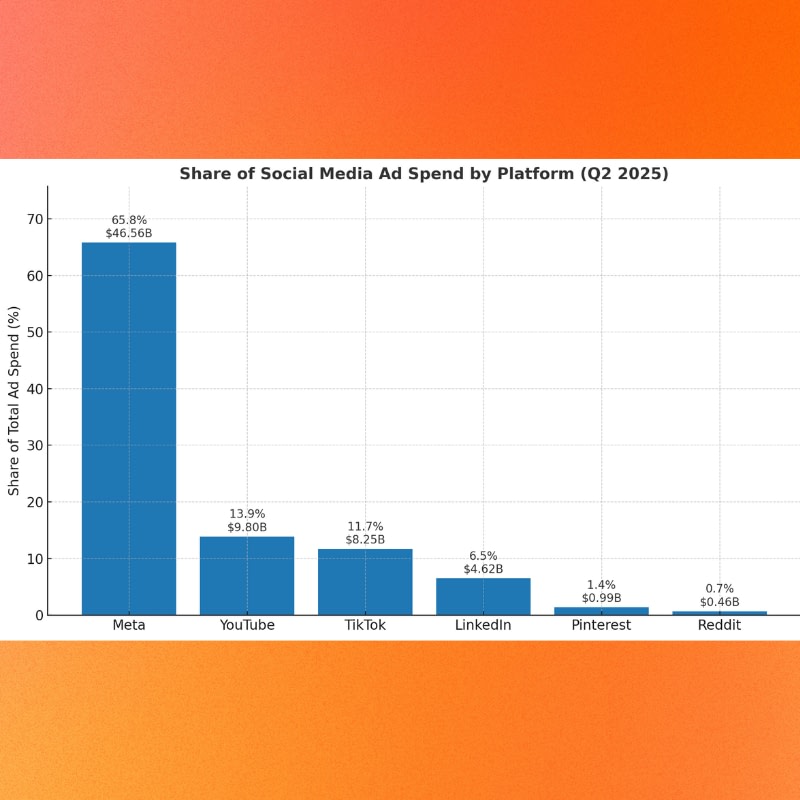
In Q2 2025, Meta concentrated 65.8% of ad spend.
In the mid-tier, we have YouTube (13.9%), TikTok (11.7%), and LinkedIn (6.5%).
Trailing behind (but with significant YoY increases) are Pinterest (1.4%) and Reddit (0.7%).
To conclude, the total social media ad spend of the quarter (for the aforementioned platforms) amounts to 70.68 billion.
Methodology
We looked at the advertising revenue each company disclosed in their Q2 2025 earnings press releases (links below).
For TikTok, we used a widely cited third-party estimate.
Formula used:
Market_Share(Platform) = (Platform_Ad_Revenue ÷ Total_Ad_Revenue) × 100
Note: this covers social media ad revenue only. It does not include Google Search ads, Amazon retail media, or CTV spend.
Why this data matters
For marketers and planners, it’s practical: You want a quick-glance chart that shows how much of the pie each platform holds.
For others, it’s about the bigger picture: This data shows where brands are actually putting their money.
That can help with:
- Competitor analysis: Are rivals investing where you’re absent?
- Spend progression: Are budgets flowing to the fast growers (TikTok, Reddit) or staying with the incumbents (Meta, YouTube)?
- Period comparison: How has Q2 shifted from Q1, or from last year?
- Foresight: Spotting rising channels before they go fully mainstream.
In short, it’s about understanding the current gravity of social media platforms.
What to do with this data
You now know who’s winning the share of the wallet. Here are a few practical ways to use it:
- Benchmark your mix: Compare your own budget breakdown per platform against the market. Are you aligned, underweight, or overweight somewhere? Why?
- Check YoY alignment: Calculate your own year-over-year social spend growth. Are you tracking with the market or falling behind?
- Spot growth plays: If Reddit’s up 84% YoY, is there a test budget you should carve out?
Ad spend is a map of where attention is being bought and sold.
If your budget feels like it’s on autopilot, this snapshot can be a compass.
Want to talk about how to get the most out of your current budget, whether that means scaling Meta or experimenting on TikTok? Then let’s talk.
Sources: